In [260]:
import pandas as pd
import numpy as np
import matplotlib.pyplot as plt
from sklearn.preprocessing import OneHotEncoder
from sklearn.compose import ColumnTransformer
from sklearn.model_selection import train_test_split
from sklearn.linear_model import LinearRegression
In [244]:
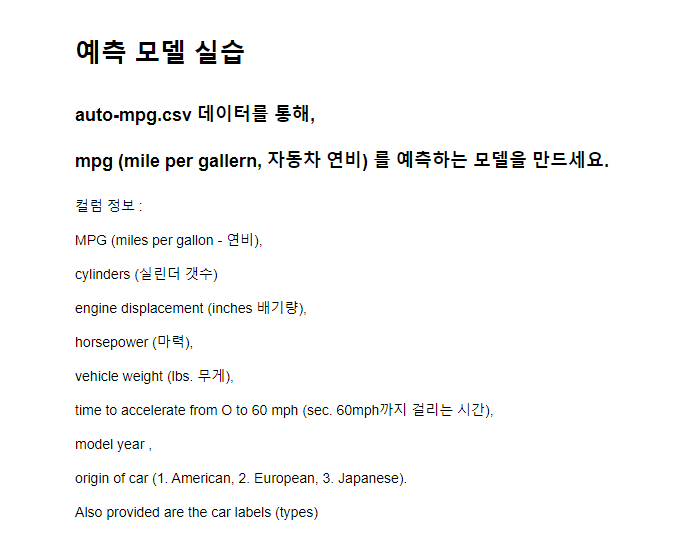
df=pd.read_csv("../data/auto-mpg.csv")
In [245]:
df.head(2)
Out[245]:
| mpg | cyl | displ | hp | weight | accel | yr | origin | name | |
|---|---|---|---|---|---|---|---|---|---|
| 0 | 18.0 | 8 | 307.0 | 130 | 3504 | 12.0 | 70 | 1 | chevrolet chevelle malibu |
| 1 | 15.0 | 8 | 350.0 | 165 | 3693 | 11.5 | 70 | 1 | buick skylark 320 |
In [246]:
df.describe()
Out[246]:
| mpg | cyl | displ | hp | weight | accel | yr | origin | |
|---|---|---|---|---|---|---|---|---|
| count | 392.000000 | 392.000000 | 392.000000 | 392.000000 | 392.000000 | 392.000000 | 392.000000 | 392.000000 |
| mean | 23.445918 | 5.471939 | 194.411990 | 104.469388 | 2977.584184 | 15.541327 | 75.979592 | 1.576531 |
| std | 7.805007 | 1.705783 | 104.644004 | 38.491160 | 849.402560 | 2.758864 | 3.683737 | 0.805518 |
| min | 9.000000 | 3.000000 | 68.000000 | 46.000000 | 1613.000000 | 8.000000 | 70.000000 | 1.000000 |
| 25% | 17.000000 | 4.000000 | 105.000000 | 75.000000 | 2225.250000 | 13.775000 | 73.000000 | 1.000000 |
| 50% | 22.750000 | 4.000000 | 151.000000 | 93.500000 | 2803.500000 | 15.500000 | 76.000000 | 1.000000 |
| 75% | 29.000000 | 8.000000 | 275.750000 | 126.000000 | 3614.750000 | 17.025000 | 79.000000 | 2.000000 |
| max | 46.600000 | 8.000000 | 455.000000 | 230.000000 | 5140.000000 | 24.800000 | 82.000000 | 3.000000 |
In [247]:
df.isna().sum()
Out[247]:
mpg       0
cyl       0
displ     0
hp        0
weight    0
accel     0
yr        0
origin    0
name      0
dtype: int64
In [248]:
df.info()
<class 'pandas.core.frame.DataFrame'>
RangeIndex: 392 entries, 0 to 391
Data columns (total 9 columns):
 #   Column  Non-Null Count  Dtype
---  ------  --------------  -----
 0   mpg     392 non-null    float64
 1   cyl     392 non-null    int64
 2   displ   392 non-null    float64
 3   hp      392 non-null    int64
 4   weight  392 non-null    int64
 5   accel   392 non-null    float64
 6   yr      392 non-null    int64
 7   origin  392 non-null    int64
 8   name    392 non-null    object
dtypes: float64(3), int64(5), object(1)
memory usage: 27.7+ KB
In [249]:
y = df["mpg"]
In [250]:
y
Out[250]:
0      18.0
1      15.0
2      18.0
3      16.0
4      17.0
       ...
387    27.0
388    44.0
389    32.0
390    28.0
391    31.0
Name: mpg, Length: 392, dtype: float64
In [251]:
X = df.iloc[:,1:-2+1 ]
In [ ]:
In [252]:
X
Out[252]:
| cyl | displ | hp | weight | accel | yr | origin | |
|---|---|---|---|---|---|---|---|
| 0 | 8 | 307.0 | 130 | 3504 | 12.0 | 70 | 1 |
| 1 | 8 | 350.0 | 165 | 3693 | 11.5 | 70 | 1 |
| 2 | 8 | 318.0 | 150 | 3436 | 11.0 | 70 | 1 |
| 3 | 8 | 304.0 | 150 | 3433 | 12.0 | 70 | 1 |
| 4 | 8 | 302.0 | 140 | 3449 | 10.5 | 70 | 1 |
| ... | ... | ... | ... | ... | ... | ... | ... |
| 387 | 4 | 140.0 | 86 | 2790 | 15.6 | 82 | 1 |
| 388 | 4 | 97.0 | 52 | 2130 | 24.6 | 82 | 2 |
| 389 | 4 | 135.0 | 84 | 2295 | 11.6 | 82 | 1 |
| 390 | 4 | 120.0 | 79 | 2625 | 18.6 | 82 | 1 |
| 391 | 4 | 119.0 | 82 | 2720 | 19.4 | 82 | 1 |
392 rows × 7 columns
In [253]:
X["cyl"].unique()
Out[253]:
array([8, 4, 6, 3, 5], dtype=int64)
In [254]:
X["yr"].unique()
Out[254]:
array([70, 71, 72, 73, 74, 75, 76, 77, 78, 79, 80, 81, 82], dtype=int64)
In [255]:
ct = ColumnTransformer( [ ("encoder", OneHotEncoder(), [6]) ], remainder = 'passthrough')
In [256]:
X = ct.fit_transform( X)
In [257]:
X
Out[257]:
array([[1.000e+00, 0.000e+00, 0.000e+00, ..., 3.504e+03, 1.200e+01,
        7.000e+01],
       [1.000e+00, 0.000e+00, 0.000e+00, ..., 3.693e+03, 1.150e+01,
        7.000e+01],
       [1.000e+00, 0.000e+00, 0.000e+00, ..., 3.436e+03, 1.100e+01,
        7.000e+01],
       ...,
       [1.000e+00, 0.000e+00, 0.000e+00, ..., 2.295e+03, 1.160e+01,
        8.200e+01],
       [1.000e+00, 0.000e+00, 0.000e+00, ..., 2.625e+03, 1.860e+01,
        8.200e+01],
       [1.000e+00, 0.000e+00, 0.000e+00, ..., 2.720e+03, 1.940e+01,
        8.200e+01]])
In [258]:
X_train, X_test, y_train, y_test = train_test_split(X , y, test_size=0.2, random_state=1)
In [261]:
regressor = LinearRegression()
In [262]:
regressor.fit(X_train,y_train)
Out[262]:
LinearRegression()In a Jupyter environment, please rerun this cell to show the HTML representation or trust the notebook.
On GitHub, the HTML representation is unable to render, please try loading this page with nbviewer.org.
LinearRegression()
In [263]:
y_pred = regressor.predict(X_test)
In [264]:
y_pred
Out[264]:
array([23.94462531, 28.64761934, 32.33077781, 21.99464755, 35.28265957,
       28.12319115, 26.45524167, 12.58160302, 25.56306456, 32.04254865,
       23.32597109, 32.29214001, 20.14095012, 31.77638576, 29.46904954,
       15.04190357, 30.0344167 , 32.62473165, 10.92503097, 22.93824236,
       27.20037833, 17.75867846, 18.10527569, 16.16985336, 10.79919676,
       20.03178998, 31.66807007, 18.42520819, 21.73299914, 29.1359896 ,
       21.92214974, 24.36825885, 10.33853798, 28.57027834, 20.81243752,
       14.53200154, 16.94944932, 21.21237735, 35.27195558, 24.73713275,
       16.12598196, 11.89879942, 22.60011043, 22.26645573, 22.1334667 ,
       17.99528974,  8.68452228, 35.73286016, 21.07296509, 10.51727695,
       15.10201083, 23.20486955, 27.21539361, 30.31799228, 34.51063284,
       20.79063836, 26.05083995, 20.90202994, 26.71031312, 33.73741146,
       28.52415583, 27.14325924, 35.16257625, 22.03416555, 22.81474093,
       20.99775758, 22.69550132, 14.0908763 , 32.84090607,  6.40461693,
       30.72823425, 20.98887219, 18.35621099, 32.14480289, 23.79497128,
       30.57166865, 20.49454935, 12.24164985, 11.67133326])
In [265]:
y_test
Out[265]:
81     23.0
165    29.0
351    32.4
119    19.0
379    38.0
       ...
23     26.0
293    35.7
13     14.0
90     13.0
61     13.0
Name: mpg, Length: 79, dtype: float64
In [267]:
error = y_test-y_pred
In [268]:
error
Out[268]:
81    -0.944625
165    0.352381
351    0.069222
119   -2.994648
379    2.717340
         ...
23     2.205029
293    5.128331
13    -6.494549
90     0.758350
61     1.328667
Name: mpg, Length: 79, dtype: float64
In [270]:
(error ** 2).mean()
Out[270]:
11.882268558597138
In [ ]:
In [271]:
# 새로운 자동차가 나왔습니다.
# displ 301, hp 133, cyl 6, weight 2900, accel 10.7, yr 81, origin 2(유럽차)
# 이차의 연비예측?
In [272]:
df.head(1)
Out[272]:
| mpg | cyl | displ | hp | weight | accel | yr | origin | name | |
|---|---|---|---|---|---|---|---|---|---|
| 0 | 18.0 | 8 | 307.0 | 130 | 3504 | 12.0 | 70 | 1 | chevrolet chevelle malibu |
In [286]:
new_data = np.array([6,301,133,2900,10.7,81,2])
In [287]:
new_data = new_data.reshape(1,7)
In [288]:
new_data
Out[288]:
array([[6.00e+00, 3.01e+02, 1.33e+02, 2.90e+03, 1.07e+01, 8.10e+01,
        2.00e+00]])
In [289]:
new_data=ct.transform(new_data)
C:\Users\5-10\Anaconda3\envs\YH\lib\site-packages\sklearn\base.py:450: UserWarning: X does not have valid feature names, but OneHotEncoder was fitted with feature names
  warnings.warn(
In [290]:
regressor.predict(new_data)
Out[290]:
array([30.51076092])
In [ ]:
In [ ]:
# 인공지능과 ct 를 파일로 저장하기
In [291]:
import joblib
In [292]:
joblib.dump(regressor, 'regressor.pkl')
Out[292]:
['regressor.pkl']
In [293]:
joblib.dump(ct, 'ct.pkl')
Out[293]:
['ct.pkl']
'DataScience > MachineLearning' 카테고리의 다른 글
| Machine Logistic Regression 데이터의 결점보완(0,nan), 데이터의 불균형 up sampling 기법, 결과를 히트맵으로 표현 (0) | 2022.12.02 |
|---|---|
| Machine [supervised{Classification(Logisticregression)}] (0) | 2022.12.02 |
| Machine Multiple Linear Regression (0) | 2022.12.01 |
| Machine [supervised{Prediction(Linear Regression)}] (0) | 2022.12.01 |
| Machine preprocessing, Feature Scaling, Dataset Training & Test (0) | 2022.12.01 |


